How to live stress free with peak values – A Structural Engineer’s Quick Guide to Peak Values in FE Analysis
How to live stress free with peak values – A Structural Engineer’s Quick Guide to Peak Values in FE Analysis
Peak Values are Caused by Geometric Reasons and the Linear Material Model
If you have ever performed FE analysis, you have undoubtedly encountered this issue: in an FE model, stress often rises to 600 MPa in a single FE element near a small discontinuity, or the program suggests required reinforcement of 2700 mm²/m. Intuition suggests that this value in FE model is not realistic. As a structural engineer, capacity is often determined based on cross-sections. For this reason, it is advantageous to use beam and shell models instead of solid models. The theory of shell models starts producing unrealistic results at approximately twice the thickness from supports, point loads, or shell intersections. A beam model connects to a shell model through a single FE element: the smaller the FE mesh, the smaller the connection area. Problems arise only in shell and solid models. Mathematically, beam models do not encounter this issue. at least 2 dimensions are needed to produce peak value. Problem becomes bigger with 3 dimensions (solids). The geometric cause of peak values is an infinitely sharp detail in the model. Another name for this phenomenon is singularity: a value that cannot be determined in the FE model or value is infinite. Real materials have strength limits, beyond which most materials no longer behave linearly. A linear material model makes shells behave too rigidly, causing small connection areas to accumulate more force than the shell’s capacity, such as: The bending or shear strength of a concrete slab or the yield strength or shear yielding of a steel plate.
Strategies for Handling Peak Values
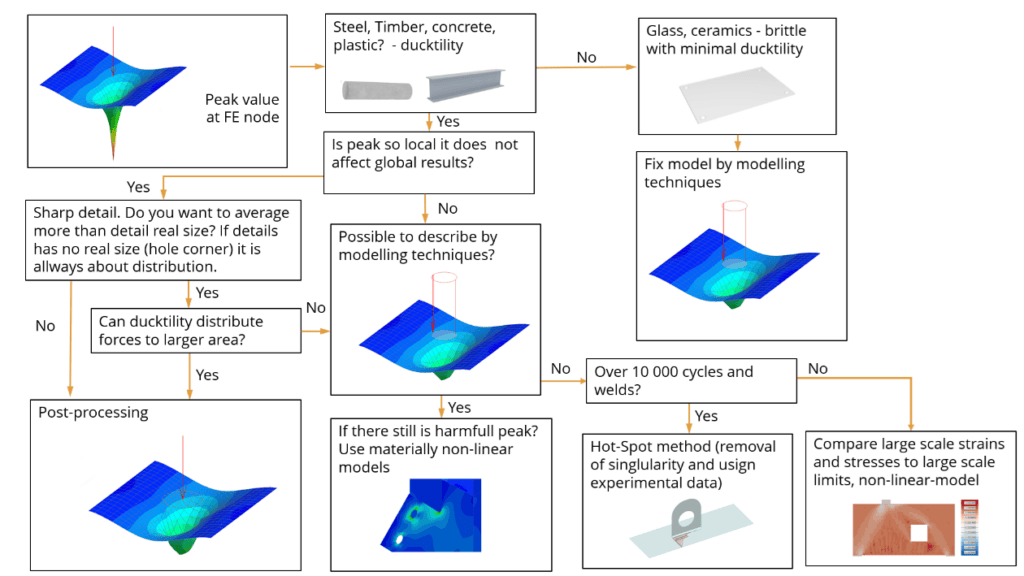
There are mainly two strategies for handling peak values: post-processing and correcting the computational model. The simplest post-processing method is engineering judgment, which has been in use for a long time. In this approach, the designer determines that values exceeding a certain threshold do not represent actual design forces or true capacity requirements. FE programs may also offer post-processing tools, which will be discussed later. Post-processing is the most practical way to manage most peak values in real applications. However, there is always a fundamental problem with post-processing: If a local issue exists in the global model, it distorts the overall force distribution. If you don’t want to read further, here is one process for handling peak values in an FE model:
Strategies for Handling Peak Values
Mesh Sensitivity Analysis as a Solution?
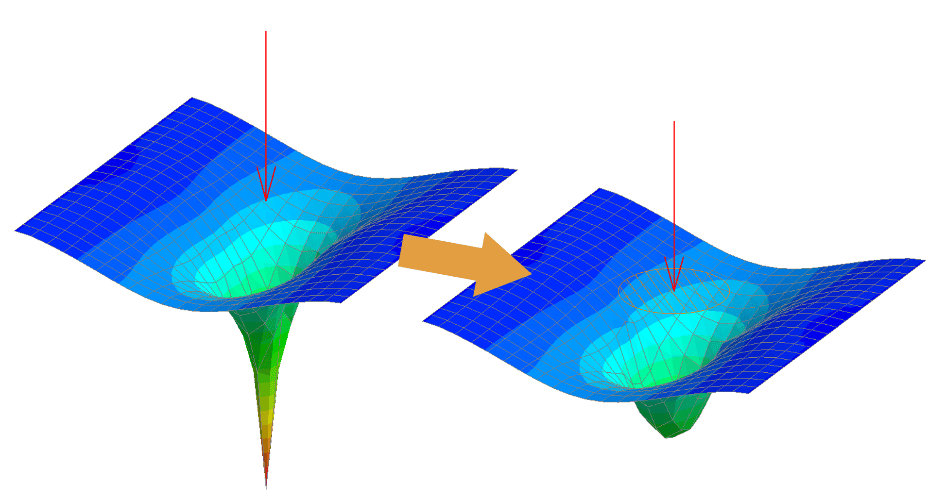
By refining the mesh more and more, the model may converge toward the correct solution. However, this only happens if the geometric problem in the model has first been corrected. If an infinitely sharp detail is present, the model will only keep producing larger values. Convergence does not occur.
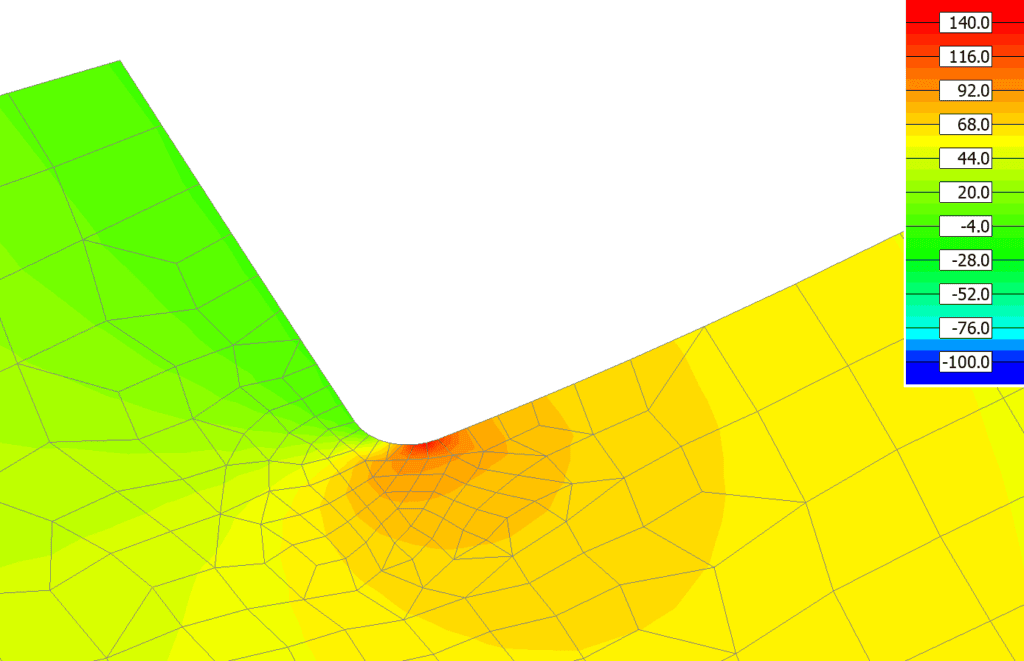
A good place to apply mesh sensitivity study: The sharp corner is replaced with a rounded edge. Software produces finite value which converges to right solution.
What About Limiting Mesh Size or Rounding Corners?
Adding corner rounding or limiting mesh size essentially serves the same purpose. If the mesh is not too fine or a corner rounding is introduced, the model does not produce excessively high peak values. The problem with corner rounding arises in structures where no well defined rounding is physically present (e.g., concrete, timber). How large should the rounding then be? Then its up to engineering judgement. Limiting mesh size is difficult because achieving repeatable results is challenging by this method. A better method is often post-processing which is less sensitive and more repeatable.
Second-Order Meshing and Peak Values – Benefit or Drawback?
Many modern FE programs use second-order meshing, where auxiliary elements are added between standard FE nodes to better capture force variation shape between main nodes. In other word they better predict peak values and nature of change between nodes. A coarser mesh can highlight peak values more accurately and help prevent shear locking. Since most peak values need to be either processed or corrected, second-order meshing is actually an advantage — it makes peak values easier to detect.
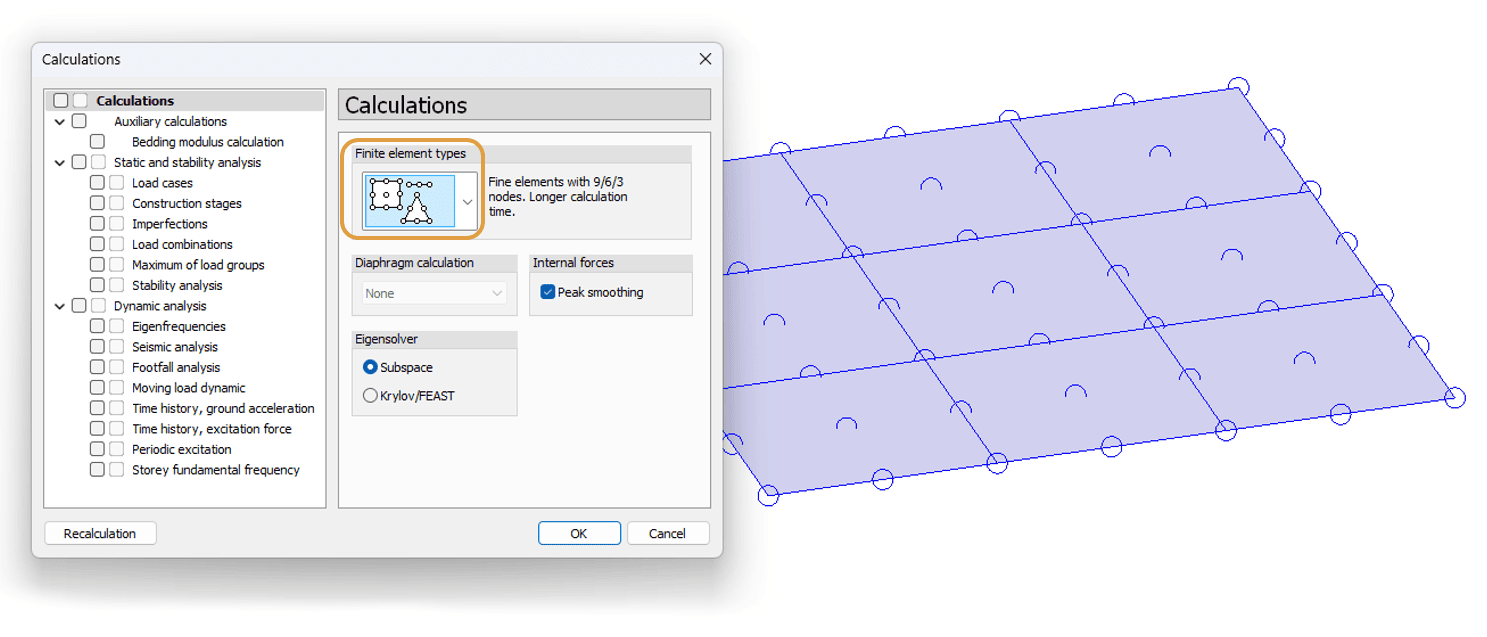
Second order mesh setting and FE mesh with auxiliary elements. Default setting in FEM-Design is second order mesh.
Post-Processing of Peak Bending Moments – Integration and Function Fitting
If a local detail does not significantly impact the overall force distribution, the easiest solution is often to use post-processing tools, such as Averaging multiple FE nodes or fitting a function to the data. In reality, point-like support behaves as a cone and distribute load to mid-plane of slab. Rule of thumb for peak smoothing size for hard supports and hard point loads: support width or the area influenced by the point load plus thickness of slab or plate (cone). In practice, this often corrects the model point-like error with reasonable accuracy. If a larger area is averaged, it becomes more about engineering judgment and plastic force redistribution, rather than just correcting an imperfect model. With sharp details without size like hole corners averaging and function fitting is always about force re-distribution. When re-distribution of the forces is used, the engineer always has to estimate details of deformations capacity to distribute loads: is ultimate strain already used?
Where Should Smoothing Areas Be Placed?
By default, peak smoothing areas should be placed, every point support, Wall corners, point corners and sharp features like hole corners. Additionally, every slab edge requires smoothing for shear forces. All these points do not converge to any real solution.
Sharp corners are always peak stress or so called singularity points.
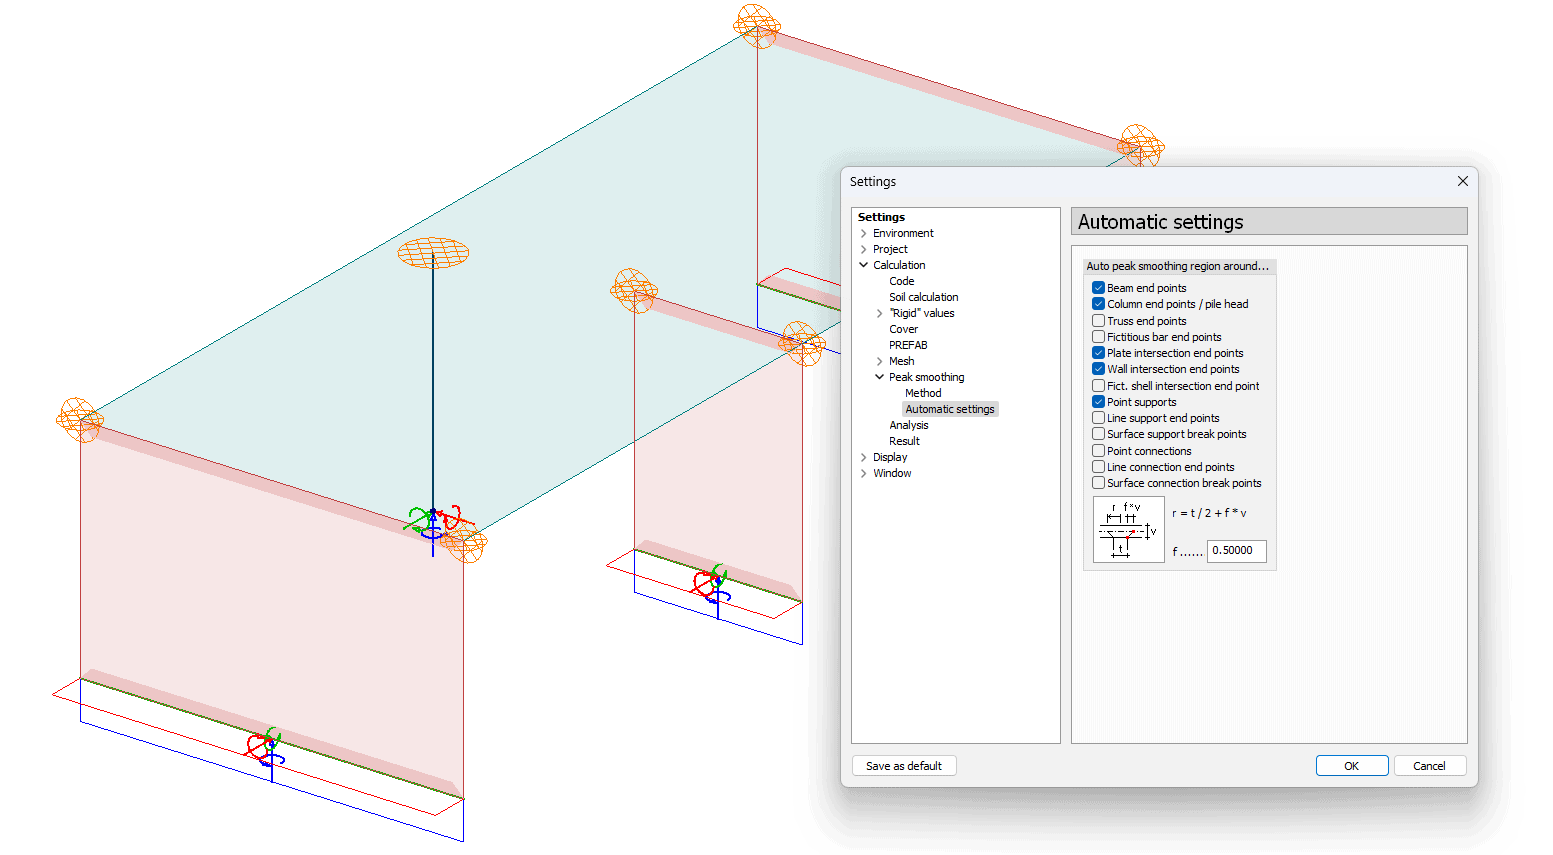
Automatic Generation of Smoothing Areas
Especially with reinforced concrete slabs and CLT elements, there are many points where peak values can occur. It is useful to automatically generate as many peak smoothing areas as possible. Smoothing areas can be entered in the FEM-Design program using the PEAK SMOOTHING tool. Tools automatic peak smoothing generation can be found in the program settings: how much size is increased in addition to the width of the support itself. Often it is a function of the thickness of the slab. Also user can set what features gets peak smoothing. Even if automatic is used, the user must always check the result and, if necessary, correct the sizes of the areas based on their own judgment: the size of the area can be different, for example, in tension side loads with partially brittle materials such as timber. In addition, it is the user’s responsibility to check how the areas are positioned in relation to the FE mesh. If user wants, the program can automatically densify the mesh in averaging areas to get more consistent smoothing result.
Sharp corners are also points where the model generates infinitely large internal forces.
What About Shear Forces?
Shear force peaks can be even more problematic than bending moment peaks. Typical locations for infinite shear values are Sharp corners of holes, Edges of concrete slabs or timber panels where column, or pile or wall end point is near the edge. For edges of RC slabs or CLT one solution is to distribute shear forces to a fictitious “edge beam” or use peak smoothing areas along the slab edges (one-way averaging).
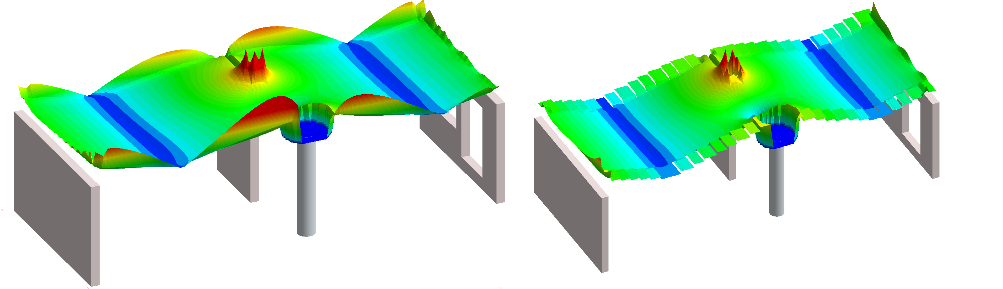
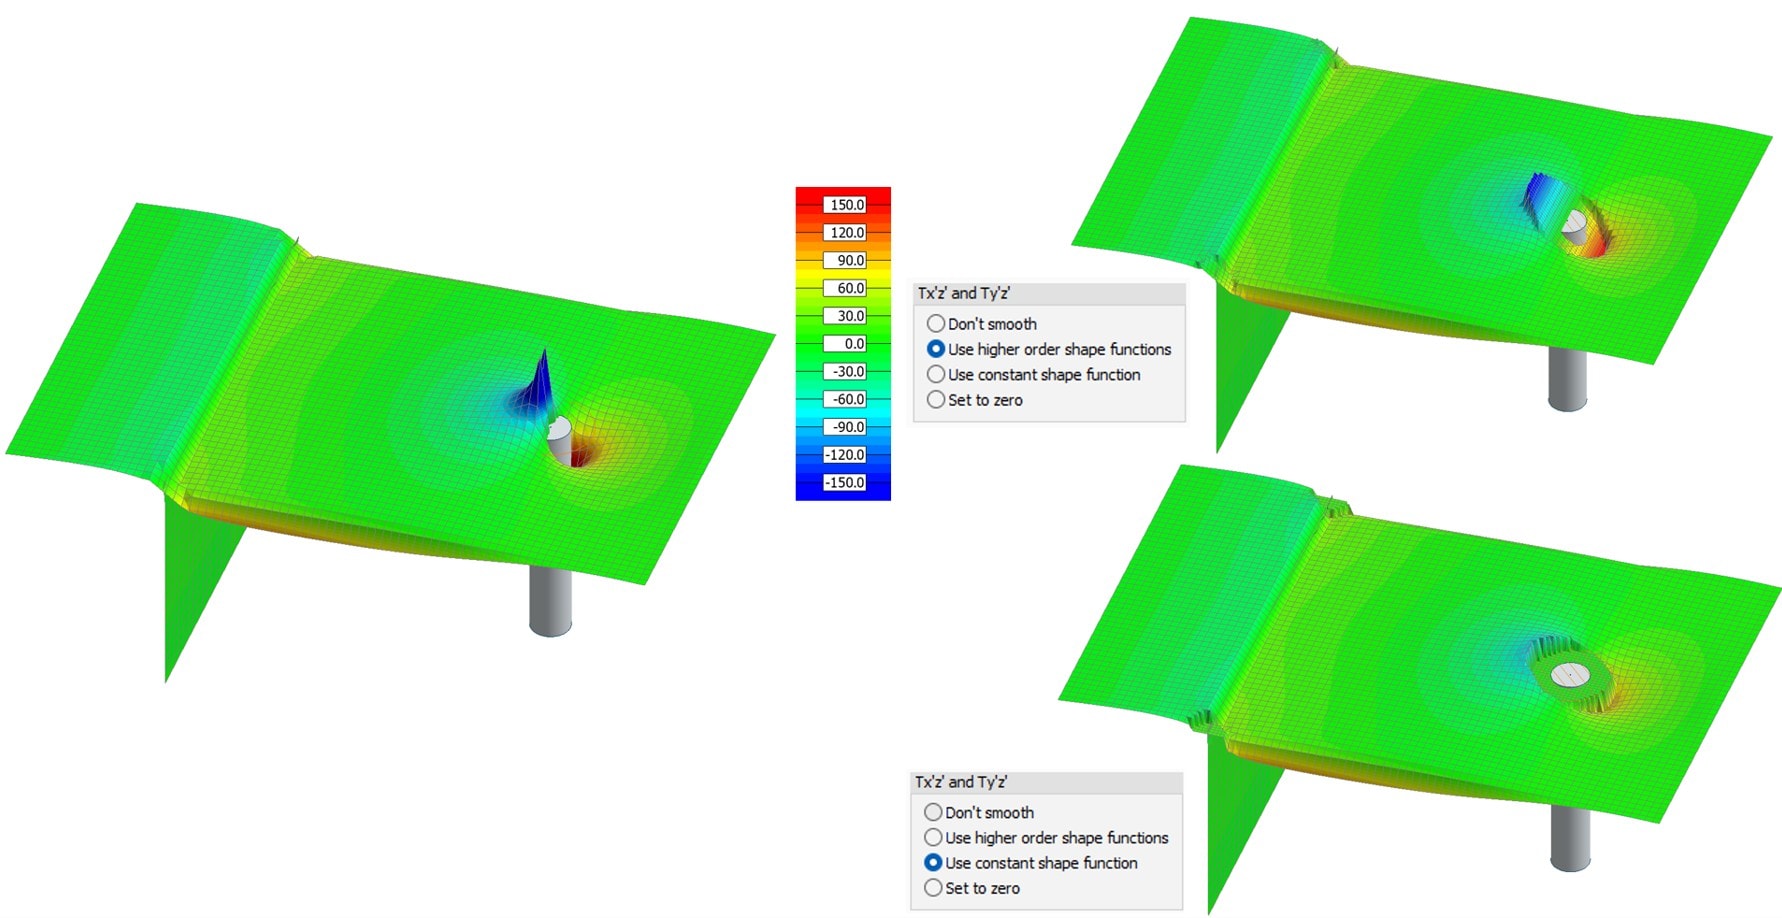
RC Slab shear force edge concentration was produced by the continuum model before and after post processing. Re-distribution of slab shear force to fictitious edge beam. Peak smoothing areas are placed on the slab edge so that a small gap is between areas (one-way smoothing, areas are not connected). Method: constant shape function. Users should always check how peak smoothing areas are located in the FE mesh.
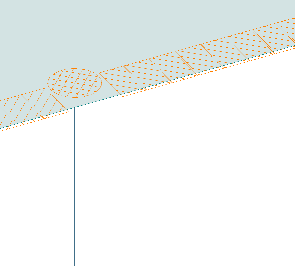
RC Slab shear force edge concentration was produced by the continuum model before and after post processing. Re-distribution of slab shear force to fictitious edge beam. Peak smoothing areas are placed on the slab edge so that a small gap is between areas (one-way smoothing, areas are not connected). Method: constant shape function. Users should always check how peak smoothing areas are located in the FE mesh.
Concrete: Global Continuum Model vs. Discrete Design Model
Cross-bearing concrete slabs can be well approximated using a shell model, which is a continuum model. However, concrete is designed based on a discrete model, as reinforcement is discretely placed in the slab. Only the compression side is a continuum. In practice with ductile cross sections with reasonable reinforcement ratios, tension component (rebar) is the limiting factor, and the design model is discrete. Therefore, the minimum size of the peak smoothing region is rebar spacing. In practice bit larger area works better. The only situation where the user should be careful about average size is cross sections with high rebar ratios (concrete compression strut is a limiting factor).
Concrete: Secondary methods to increase capacity at plate and opening edges
Slab edge can have extra capacity. Edge rebar assemblies can have additional bars which is not taken into account in main FE rebars. FEM-Design has a SINGLE Bar tool, which can be used to add single bars to the edge to increase edge capacity. Also, shear rebars at age can increase capacity. However in practice peak smoothing is most effective tool to handle high shear forces at edges.
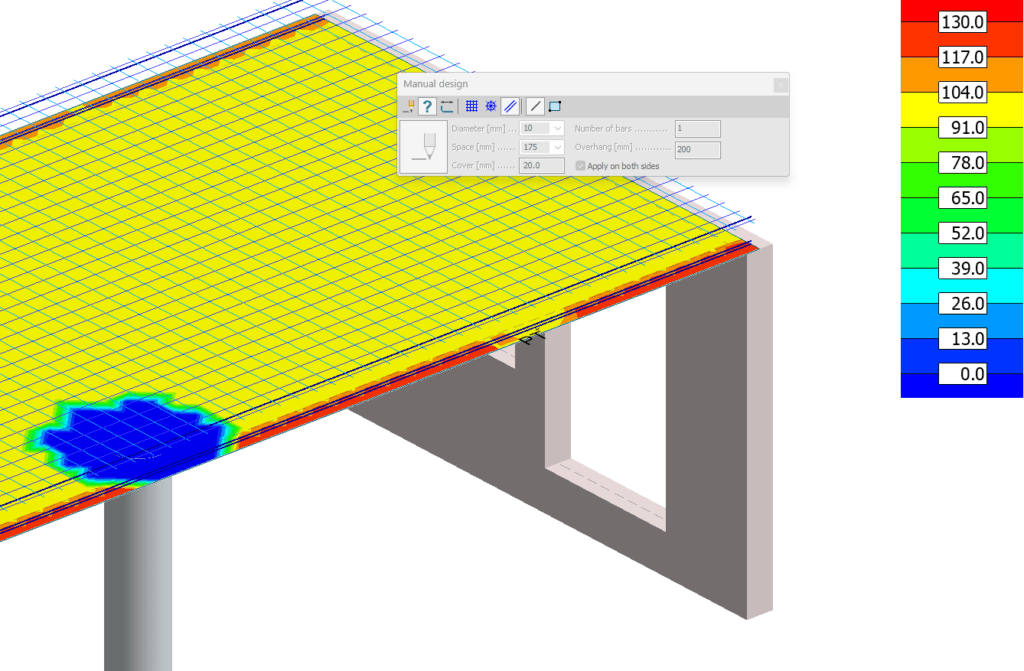
Result: RC slab shear capacity with extra bars at plate edge. SINLGE BAR tool is used to place edge bars. Also shear reduction tools in shear design can help to remove high shear forces located inside on compression cone close to supports.
Post-processing of shear forces and Normal forces: watch out for forces with a different sign
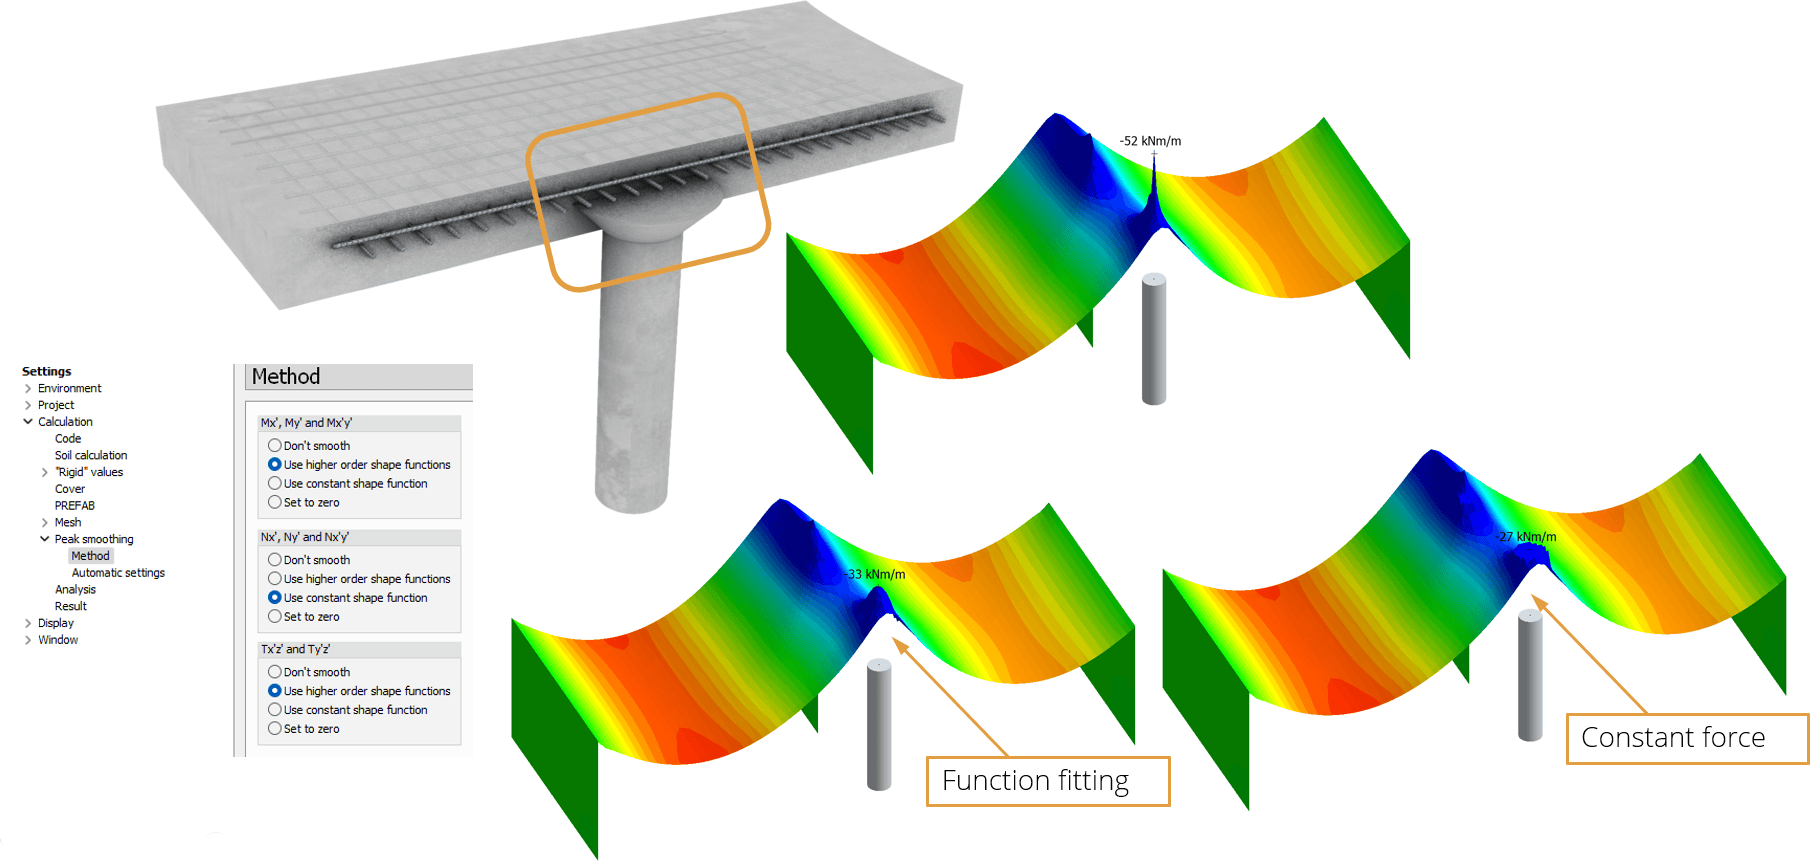
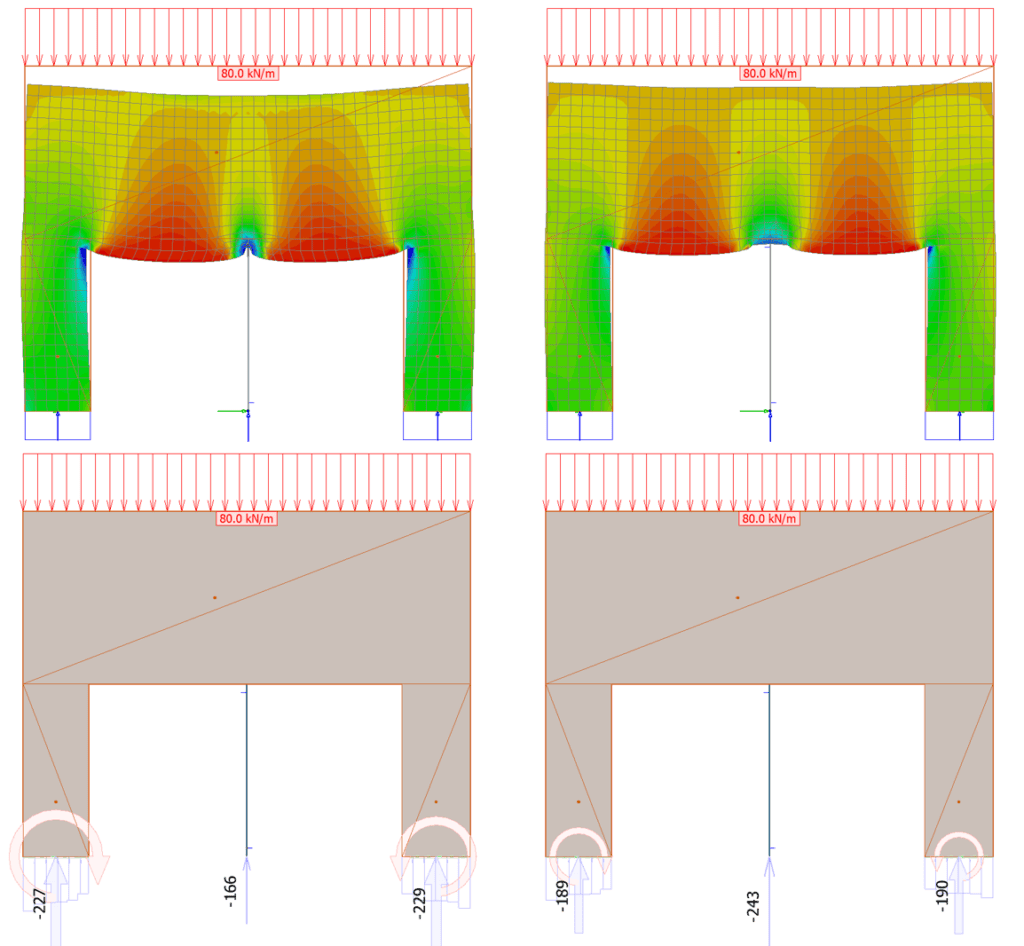
The bending moment do not often change from positive to negative close to support or detail. The shear force on the right side of the support is always of a different sign compared to the left side of the support. The most common post-processing method offered by most FE programs averaging is exactly that – calculating the average. The average of two forces with different signs is close to zero. This can be problematic when very large peak smoothing areas close to supports are used. Function fittings what FEM-Design offers produces a better result (picture below). Another suitable method is to calculate the average separately from different sides of the support. In addition, support reductions of Fem Design at shear design is a good way to remove peaks close to real supports in the design phase.
Average of different sign shear forces totally removes shear forces. Left: shear force before post processing: Right: shear force after post processing with function fitting (above) and average (below)
Global model and peak values – is my calculation model incorrect?
Point-like objects always affect the behavior of the global model. Often, peak values are very local phenomenon and the effect on the overall force distribution of the model is small. In certain situations, however, it is worth considering either correcting the model or being cautious about the design forces given by the program, both near the detail and elsewhere. Such situations include short spans in thick slabs and wall-like beams or thick footings. In these situations, the force distribution and support reactions of the model depend on the size of the mesh. If there is too much stiffness at some point (capacity exceeded), it is always taken away from the forces at some other point. If there is too little stiffness at some point (sharp point-like object), it always affects the overall force distribution. In practice, it is always good to assess how big an error a local peak value causes and whether its effect can be ignored in the overall model or whether it is worth considering modeling techniques.
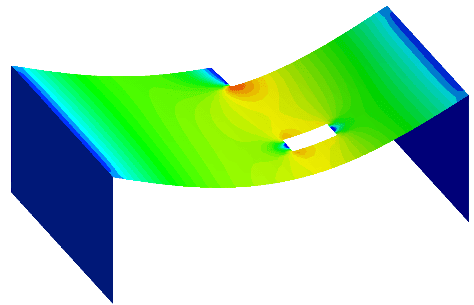
Example of a situation where a local peak value (point-like connection to the shell model) causes a significant error in the overall model. CLT wall, beam-like wall, short spans, supported by walls and 400mm glulam column. Left: column directly connected to the shell model to one node. Right: column reaction distributed over a larger area in the shell model using beam model. Significant difference in the force of the central column.
Supports as a partial source of peak values
When defining supports in FE programs, the most common choice is “rigid” or rigid support. Infinite support stiffness worsens the peak values of infinitely sharp points. Typically, the worst points in terms of support stiffness are wall corners, wall ends and piles or point supports that are close together. Rarely, the actual support is infinitely rigid. Even if the wall corner is infinitely sharp, partial support flexure is a reasonable way to prevent the worst peak values. In the FEM-Design, the starting point for support is that the default stiffness is close to the value that the supports could get in reality. Wall elements are connected together with connection elements instead of a direct FE connection. The user can deviate from this, but in most practical structures, a small flexibility is a better solution. If you are unsure, model the supporting structures.
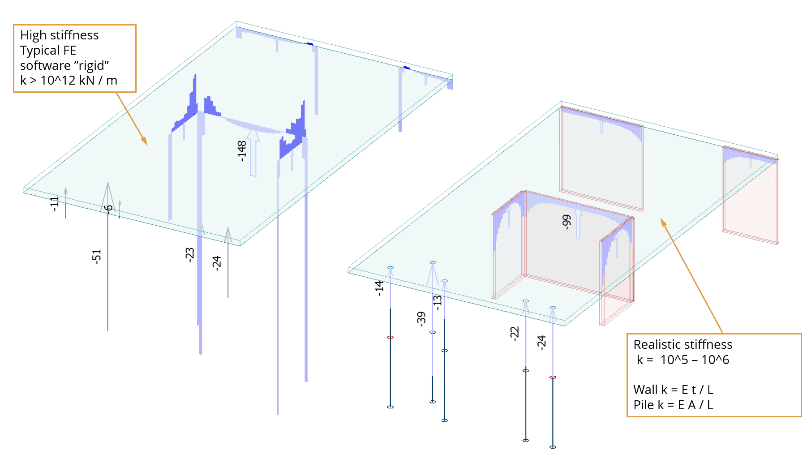
left: ultimate stiffness. right: limited stiffness and FEM design defaults. Supports stiffness can be calculated with system stiffness of supporting structures.
Loads: post-processing of point loads or surface load
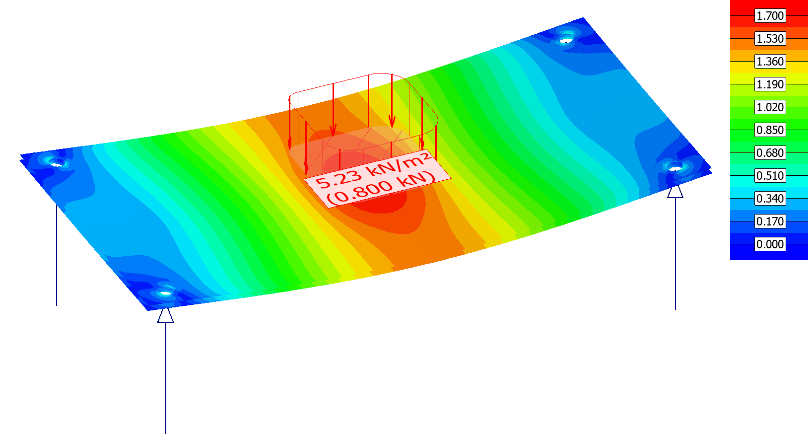
Point loads are source of peak values, as are a point supports. Often the easiest way to handle point loads is to define an averaging area for them, either by function matching or the averaging method (depending on the nature of the load). This is often the recommended method for static loads. Another method is to replace the point load with a surface load, which is given as a load resultant over area. This never produces an infinite value. The latter method is suitable for moving traffic loads and, for example, forklift wheel loads or similar, where the location of load varies.
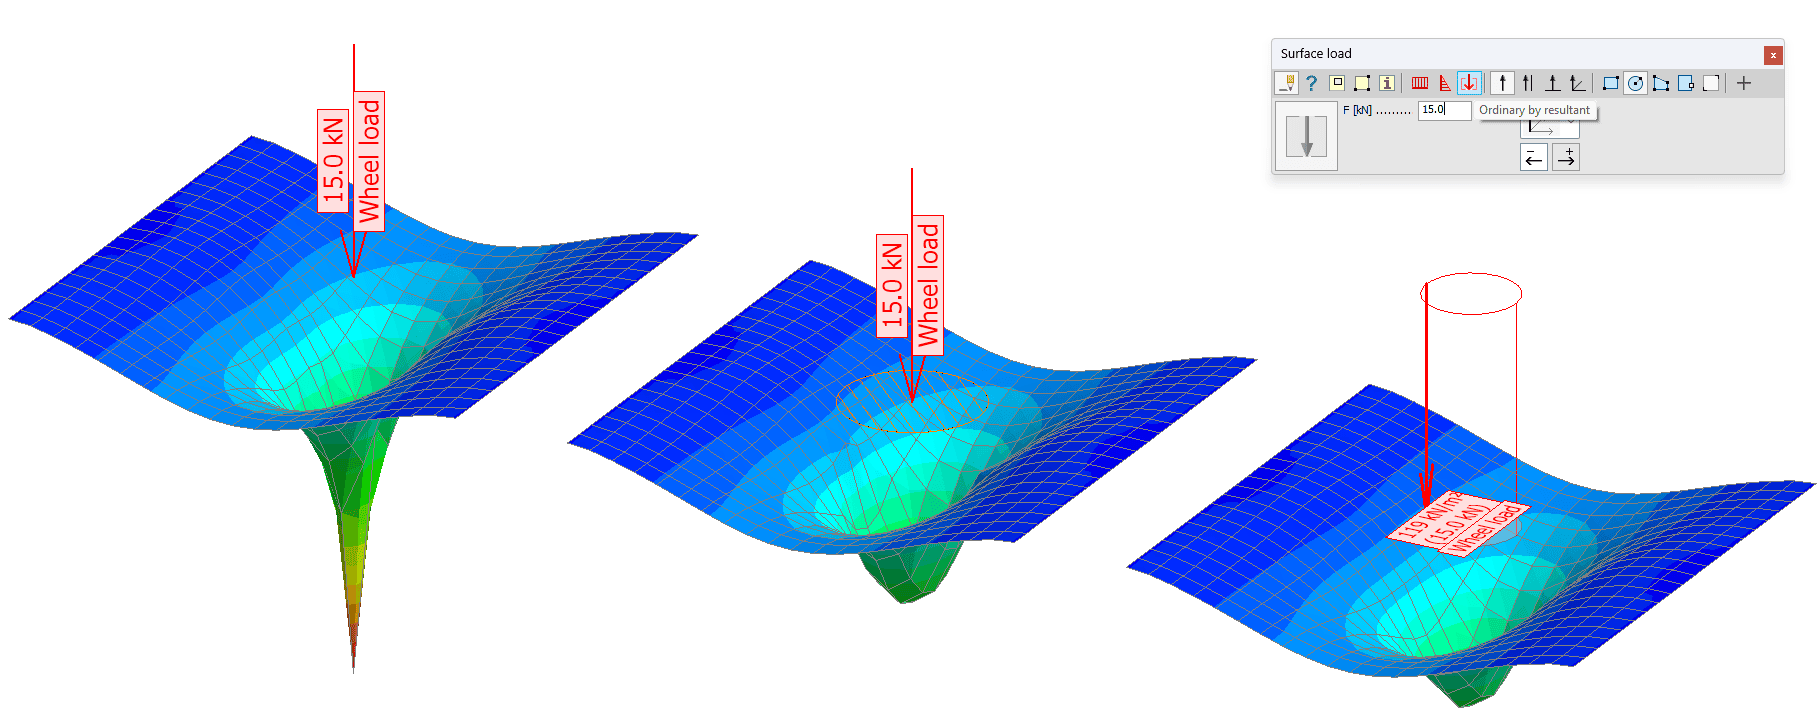
Left. Point load and slab moment = peak value. Middle: post-processing with function fitting, soft pressure. diameter: size of wheel + slab thickness. Right: Surface load with correct size. Resultant over area tool.
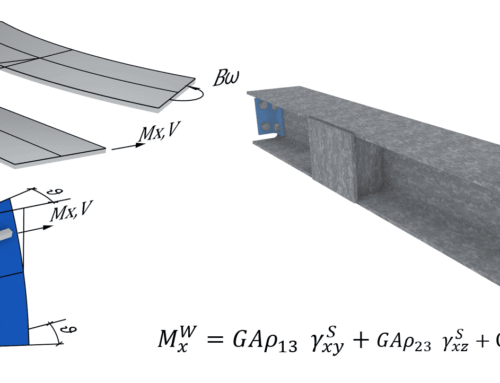
Rounding of sharp corners and similar modelling techniques: a solution for structural steel
If the peak value is in a structural part whose correct geometry can be modelled with sufficient accuracy to match the manufactured part, it is worth modelling it. This means large-scale geometry. Such parts include, of course, steel plates. Adding corner rounding gives a finite peak value for the stress. If the stress is above the yield point, a nonlinear material model should be used. Other similar modelling techniques include replacing point-like single FE node connections with surface connections or line connections.
Once the large-scale geometry is known, it can be modelled more accurately. Small-scale defects that arise from manufacturing techniques cannot be described with an FE model (cracks, surface roughness, etc.)
What about less precisely defined materials like concrete or timber?
In concrete and timber structures, the exact geometry of a sharp corner is not necessarily known with the same precision as in a steel structure: the radius is undefined. In actual structures, there are many similar corners (in concrete, internal corners are compressed), and in timber, there are square sharp openings in tension parts. In practice, it is known that the structure will withstand even if the calculated stress is infinite. In reality, the peaks are not ultimately sharp, and timber and concrete are also partially ductile, like steel. Although on large-scale timber structures are designed using a linear brittle model, locally timber behaves as partially ductile. The local corner in a timber structure is not sharp, and the material is slightly elongated. It is only a matter of the amount of ultimate elongation. The local infinite stress is equalized over a larger area. Fracture only occurs when the ultimate elongation is applied over a slightly larger area.
Brittle materials – Ceramics and glass
In brittle materials, the ultimate elongation almost non-existent. The material is very close to a linear ideal model. Of course, post-processing tools must not be used in this case. In FE calculations, the structure has to be modeled so that it corresponds to reality and the stresses in the model must be kept below the yield strength even with a dense mesh. The only way is to use modelling techniques: no sharp corners: only surface supports and surface loads, only spring supports.
FE model of glass There must be no stress-accumulating details in the area of high stress. Flexible surface supports, surface load and rounded corners.
Peak Elongation and peak stress – FE model and large-scale material model do not work
In practice, it is often assumed that the peak stress will level out over a larger area as the material yields. Even a more precisely defined part, such as a steel plate, which may be precisely defined, still contains minor errors locally, where the stress in the actual structure is always above the yield strength. However, it must be remembered that material tests also contain these typical errors. Therefore, a material test result is a larger-scale strain and stress result. The same applies to concrete and timber. Although the compressive stress of concrete in a sharp corner is computationally infinite, “brittle” concrete will not fracture. The FE model cannot describe these microscopic phenomena. Only a large-scale material model can be applied to FE calculations. In addition, available information about the sensitivity of concrete and timber to local strain and stress concentrations is still limited – how much local strain is allowed. Only the global large-scale material model is known and well-defined. For example, the concrete material model averages cement, pores, cracks and aggregate without reinforcement. The grain and annual rings of timber make the material very variable in the scale of stress concentrations. CLT walls behave very differently in the scale below the width of the lamella than the scale large-scale material model assumes (the combined effect of shear, rotational shear and tension and the position of the hole in the lamella. Another problem with timber is that the elongation of timber depends a lot on the direction of the stress relative to the grain direction – timber does not tolerate local stress concentrations well when the tension is direct to the grain direction. The size of the area to be averaged can depend on the direction of the stress. The lack of clear design guidelines and practical tests makes the engineer’s job hard. Some studies have been done, but more is needed. In CLT design, averaging around the lamella scale or slightly below produces a reasonable design value.
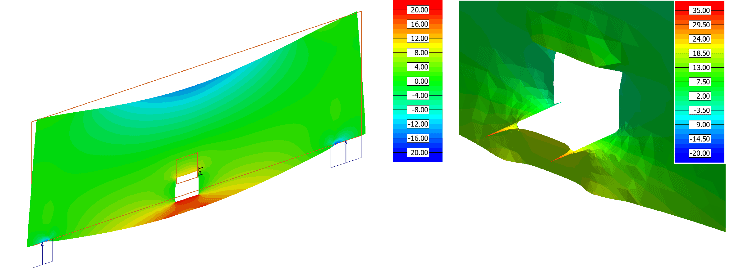
Layered shell model describes a CLT beam-like wall. Left: stresses in a horizontal lamella on a large scale. Right: stresses on a local scale at a numerical singularity. The material model and structural model are no longer applicable at a local stress concentration.
Fatigue and High Cycle Loading (>10,000 Cycles)
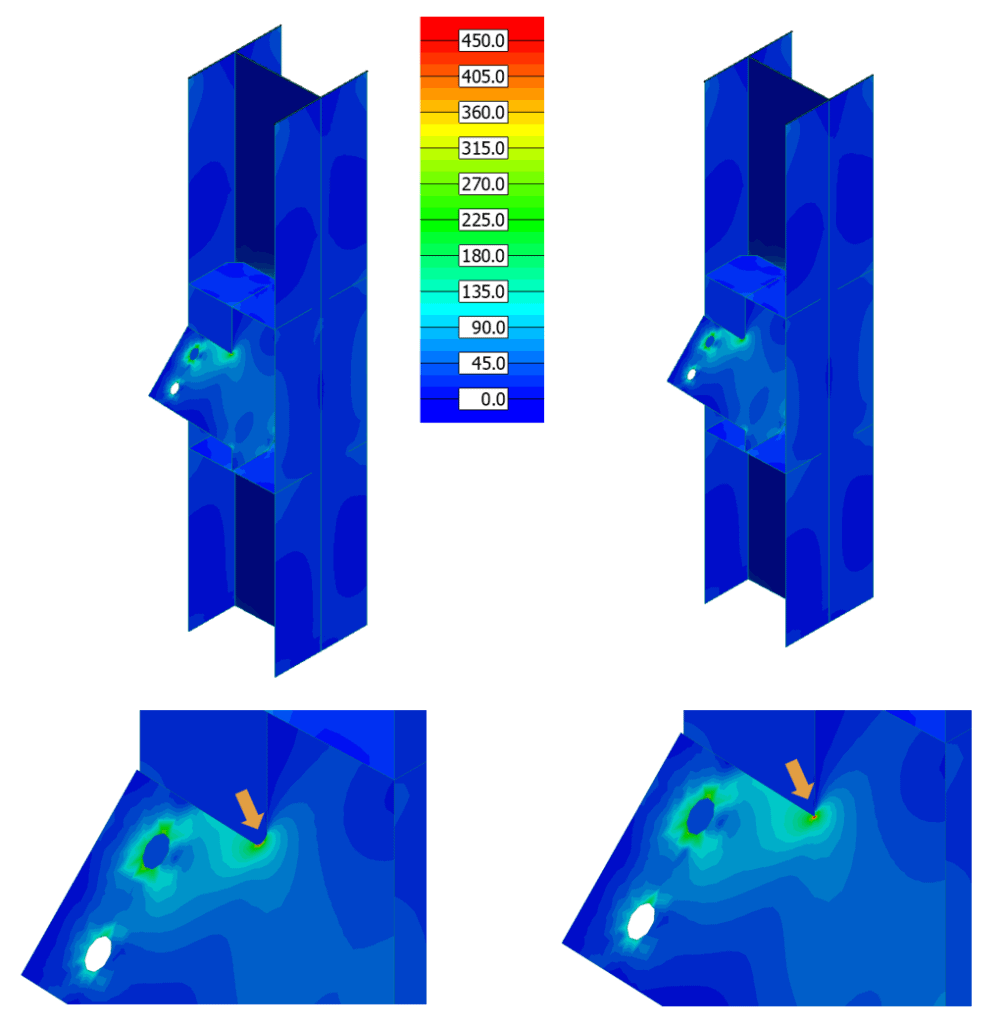
In static calculations, no microscopic phenomena are area of interest. Strength can be verified by comparing large-scale stress and strain with permissible values. When the number of cycles is large, metal fatigue is a design factor in tension concrete (often only concrete anchorage). From the point of view of FE calculations, it is known that microscopic phenomena cannot be modelled with the required accuracy; rather, they rely on test results. However, the model must correctly describe those things that can be calculated with the model: replacing sharp corners with rounding or avoiding point supports or loads. Often, in practice, only the so-called geometric stress concentration is calculated with the model. Welds are impossible to model with an FE model in fatigue analysis. The model can be used to calculate the stress in the vicinity of the weld and utilize test results that consider the imperfect, uncertain geometry of the weld, such as cracks and residual stresses. EN 1993-1-14 / 7.3 and Annex B (2020 draft) present a general way to distinguish geometric stress from local erroneous peak values in the vicinity of welds for comparison with test results (Stress Concentrations and Numerical Singularities).
Removing numerical singularity and considering microscopic material properties with experimental data. In this example, the local stress concentration on the upper surface of the base plate is small.
Nonlinear material model as a solution – Only if the geometric problem has been eliminated first
Many FE programs have nonlinear models. A very versatile nonlinear material model has also been developed for the FEM-Design, which works with concrete (taking into account the actual reinforcement) and structural steel in 3D structures. In the material model, at a local peak value, the material yields and the stress is distributed over a larger area until the load-bearing capacity and equilibrium with external loads are achieved. Has the problem of peak values been solved? Even though the stress peaks are smoothed out in nonlinear material models, the models still have strain peaks. To solve it, more accurate modeling or engineering judgment must be used.

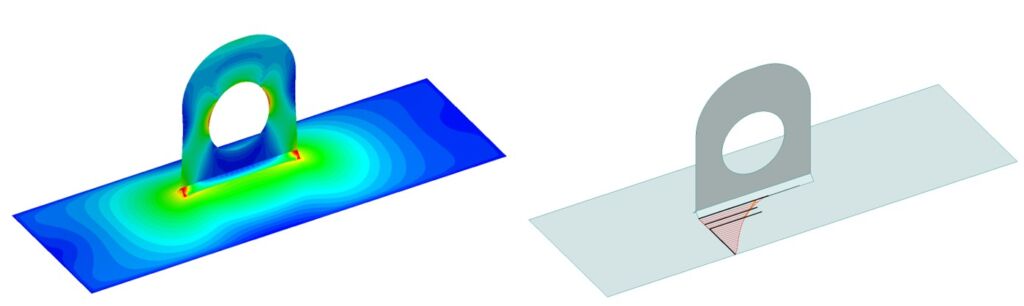
Left: Linear model without sharp corners. Right: Materially nonlinear model, including shear plasticity and damage model when the ultimate strain is exceeded. S355. The peak value flattens out over a larger area. Steel, as a ductile material, has a large deformation capacity. In numerical analysis, a limit value for strain and a safety margin for fracture, such as 5%, can be set.The peak stress is not sensitive to the mesh size.
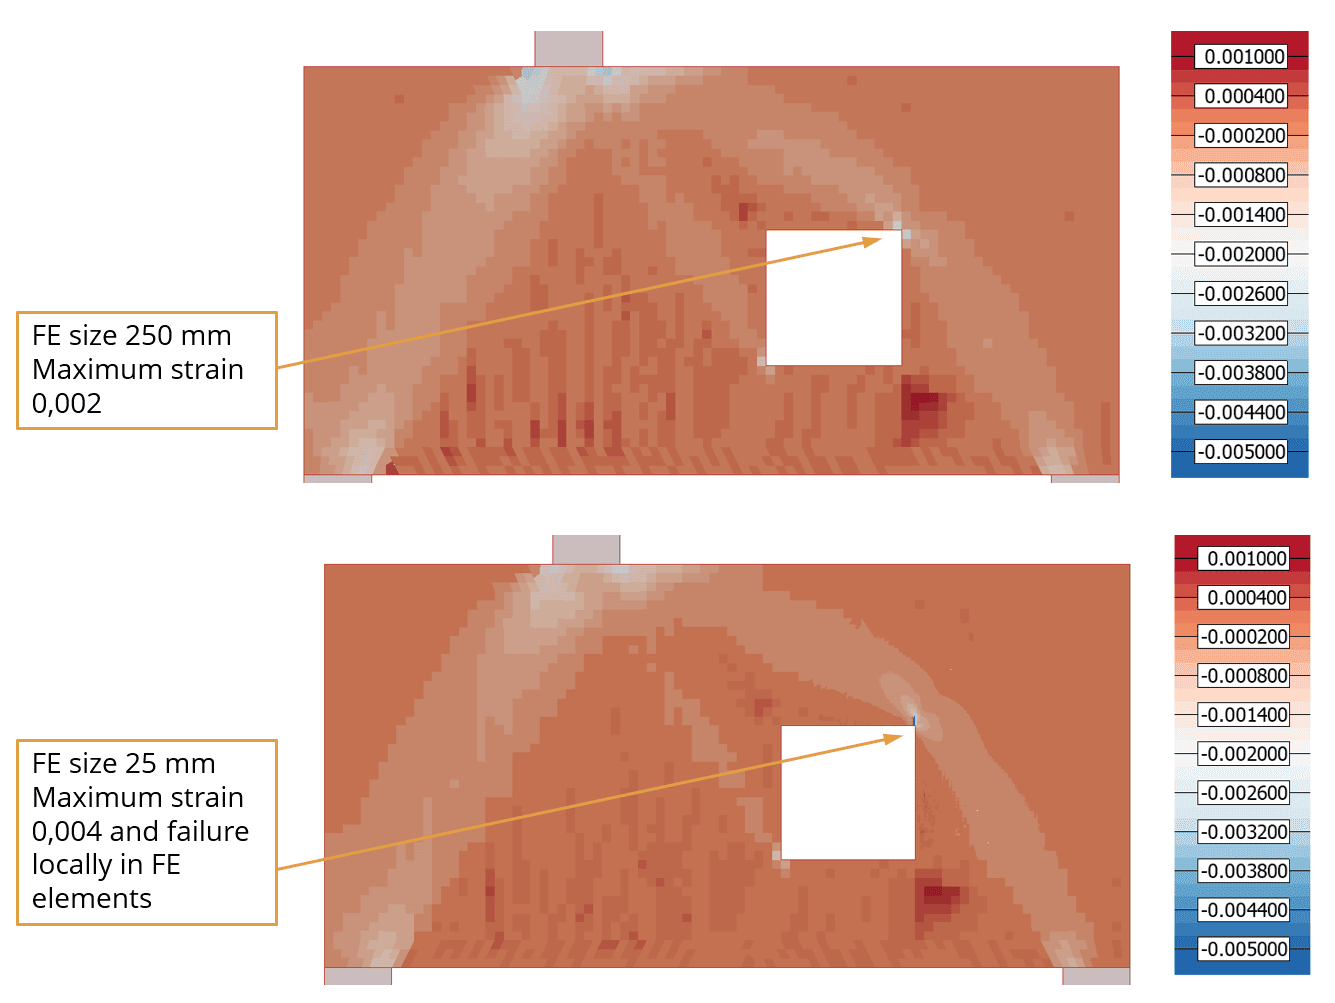
Reinforced concrete FE model with real reinforcement. and a nonlinear model for both reinforcements and concrete. The maximum strain and damage sensitivity given by the FE model depends on the mesh size. Sharp corner as a problem. The correct radius of rounding for the corner cannot be defined. In addition, the sensitivity of concrete to local strain is not well known and standardized fact - test results measure large-scale strain.
Some other problem which is not discussed here?
Here the issue of peak values is only briefly discussed and only those areas which involve normal structural engineers daily FE analysis work. If you have any other questions or are interested in the structural design solutions we offer, feel free to contact us or apply for a trial license below. We are a service – with us you are not alone.